Introducing a wide range of Dashboard Widgets
At the end of 2021, we introduced the new customisable dashboard – a new central hub for VGM that you and your technicians can entirely customise. The feedback we’ve had has been incredibly positive, and we intend to release a new wave of widgets with each upcoming release of VGM.
Our primary focus with this release is to provide a set of graphs and widgets to help display figures from key sales figures stored within VGM. When adding a new widget from your dashboard, you’ll now see new areas for:
- Sales Invoices
- Sales Credits
- Sales Quotes
- Sales Labour
- Sales Refunds
- Sales Receipts
- Sales Parts
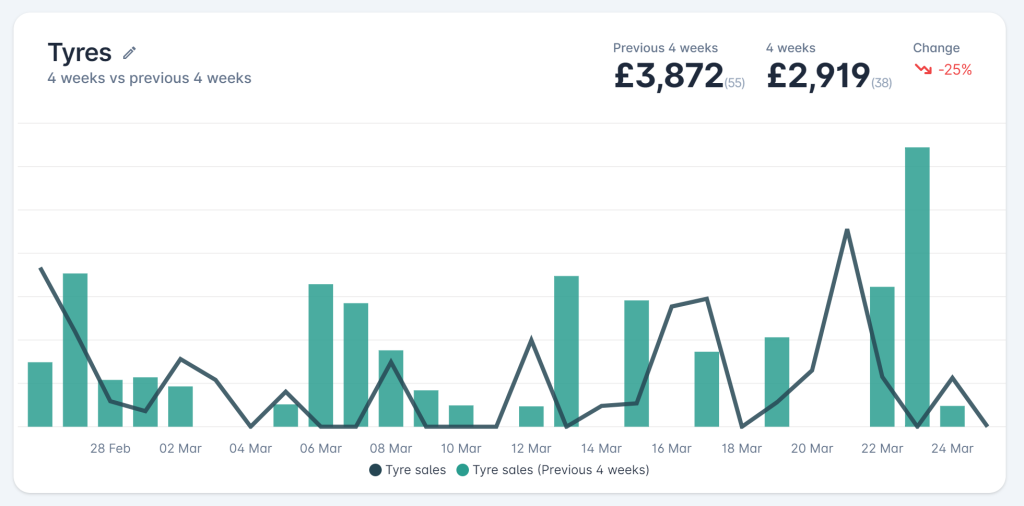
- Tyres
- SMS
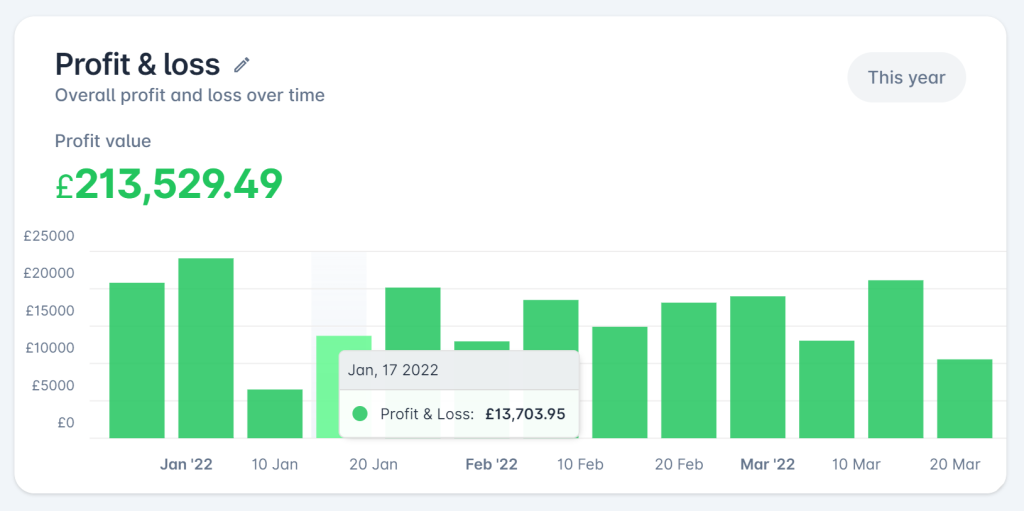
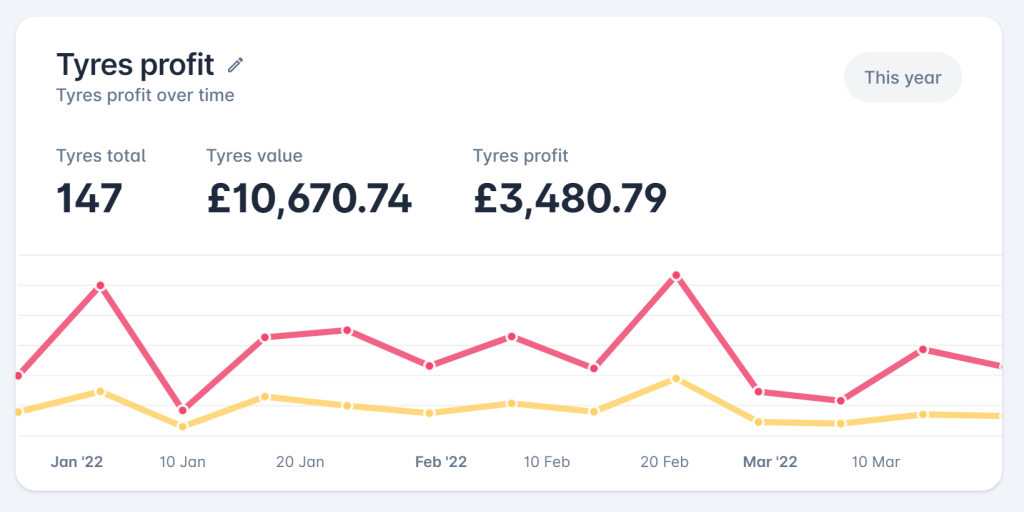
Each area features 2-3 or different graphs and charts to visualise your critical business data. Below are a few examples:


Dashboard Templates
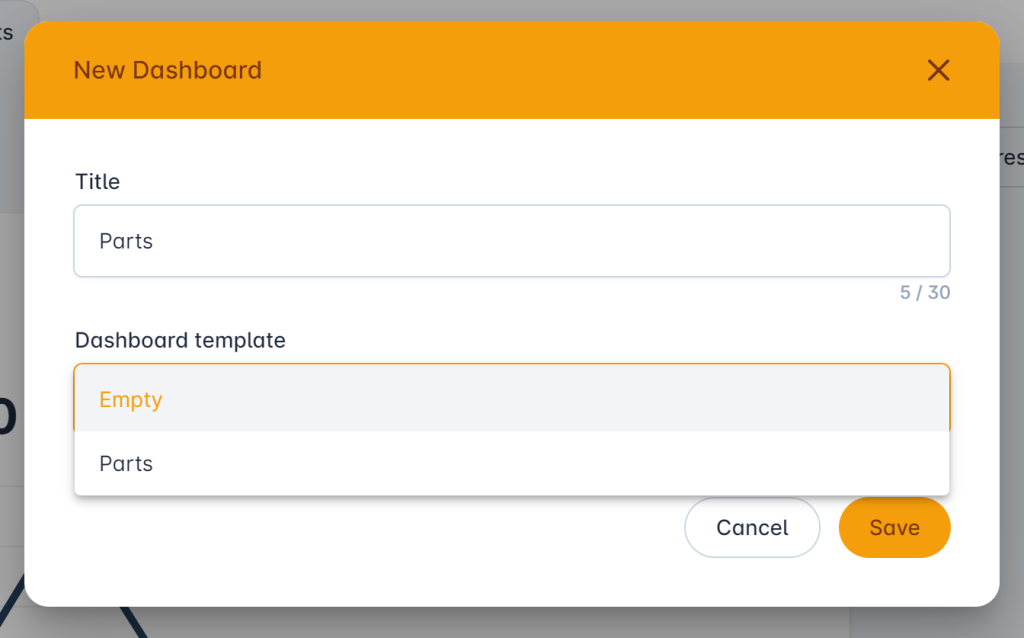
We’ve also created some default dashboard templates that can be used as a good starting point when building your dashboard. You’ll find this option when you click ‘Add Dashboard’.

How to create a new user dashboard.
For more information on how to create a user dashboard, click here to read ‘Create and edit user dashboards’.


